
NEWS
Human Fires Drive Amazon Carbon Emissions Even Without Drought
INPE aircraft flights from 2010 to 2024 show Amazon carbon emissions follow human fires, not drought alone, with 2024 the largest source in the record.

Fifteen years of aircraft CO2 profiles show Amazonia as a net carbon source of 0.32 PgC a year, driven by human fires that drought then enlarges. Luciana V. Gatti’s INPE team, with NOAA and university partners, published the 15-year aircraft carbon record on 21 October 2026, built from 1,017 vertical profiles at four sites whose upwind footprints cover 95% of a 6.7 million km2 Amazon mask.
The surprise sits in the clustering. Years of heavy clearing and weak climate stress already emitted almost as much carbon as El Nino and warm Tropical North Atlantic years. After fire is subtracted, the standing forest’s own books stay close to neutral in every group.
High Clearing Without a Drought Almost Matched El Nino Years
Bottom-up models often treat warm, dry years as the switch that turns the basin into a source. Gatti’s column budgets, which close the atmospheric mass balance from the coast to each site, split 2010 through 2024 into three clusters of Amazon years and find a different order of causes.
Group 1 holds the wetter years with lower clearing: 2011 through 2014, plus 2017 and 2018. Total carbon flux was 0.11 ± 0.08 PgC a year, small enough that INPE says Amazonia did not add much to the global budget. A biosphere sink of -0.20 ± 0.12 PgC offset 64% of fire emissions (0.32 ± 0.07 PgC). Annual clearing averaged 6,389 km2 and burned area 55,115 km2.
Group 2 is 2019 through 2022. Clearing rose 97% to 12,580 km2 a year and burned area rose 25% to 68,747 km2, while dry-season peak temperature stayed at 26.3 C, a tenth of a degree from group 1. Total carbon flux jumped to 0.43 ± 0.09 PgC a year, 291% above group 1, or about 1.58 billion tonnes of CO2. Annual rain was only 134 mm (6%) lower. A long La Nina that began in August 2020 and lasted into February 2023 lifted wet-season uptake through those years, so the remaining source is mostly people, not weather.
Group 3 packs the climate-stress years: 2010, 2015, 2016, 2023 and 2024. El Nino events in 2015-16 and 2023, and warm Tropical North Atlantic water in 2010 and 2023-24, cut annual rain by 308 mm (13%) versus group 1 and raised dry-season peak temperature to 27.3 C. Burned area rose 92% to 105,819 km2. Total carbon flux was 0.49 ± 0.07 PgC a year, about 1.80 billion tonnes of CO2. That is higher than group 2, but the paper says the two groups do not differ significantly. Fire carbon, not a collapse of the remaining forest, is what moves.
THE THREE YEAR-GROUPS
| Group | Years | Total C flux (PgC/yr) | Clearing (km2/yr) | Burned area (km2/yr) | Annual rain (mm) |
|---|---|---|---|---|---|
| 1, wet, low disturbance | 2011-14, 2017, 2018 | 0.11 ± 0.08 | 6,389 | 55,115 | 2,413 |
| 2, high clearing, low climate stress | 2019-22 | 0.43 ± 0.09 | 12,580 | 68,747 | 2,280 |
| 3, hot and dry, high fire | 2010, 2015, 2016, 2023, 2024 | 0.49 ± 0.07 | 7,812 | 105,819 | 2,105 |
Across the full 15 years, fire carbon averaged 0.40 ± 0.07 PgC a year, about 1.47 billion tonnes of CO2, larger than the net source. The forest’s non-fire exchange, net biome exchange, averaged -0.08 ± 0.12 PgC, about 300 million tonnes of CO2 taken up, too little to cover the burns.
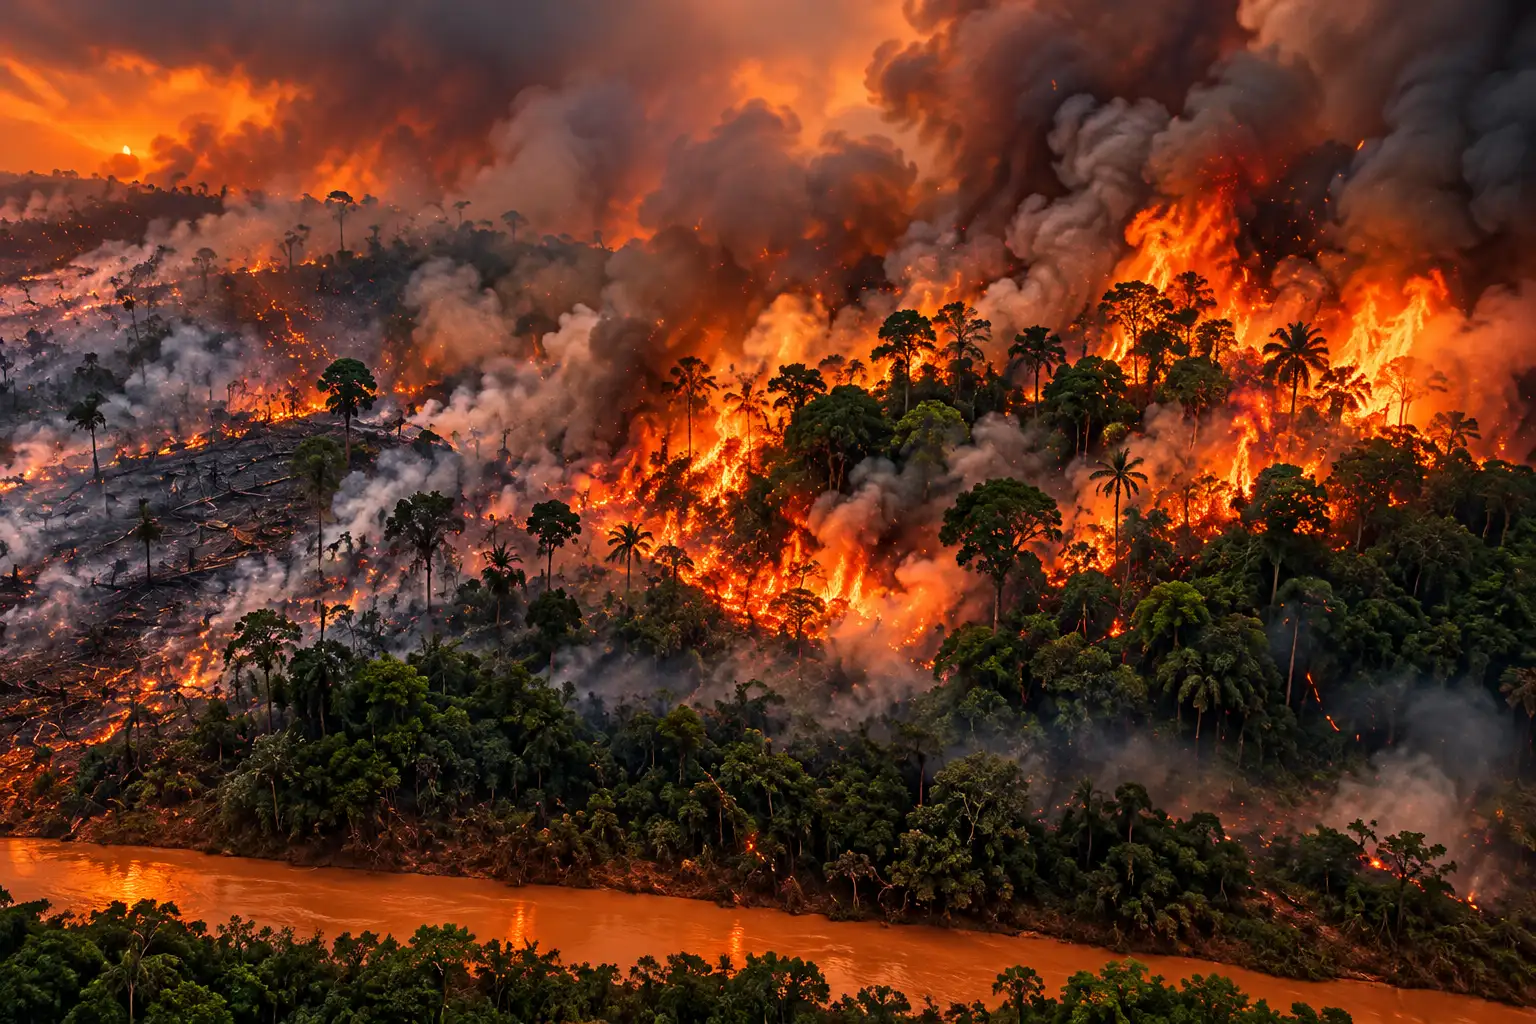
2024 Posted the Highest Source in 15 Years of Flights
Consecutive years inside group 3 went opposite ways. 2023 opened after three La Nina years and posted the largest wet-season carbon sink in the record. Annual total carbon flux fell back to 0.11 ± 0.09 PgC, the group 1 mean, even though clearing was 38% higher and burned area 52% higher than in those wet, low-disturbance years. The wet-season sink covered 75% of dry-season emissions. Temperature started cooler than normal, then climbed as El Nino and a warm Tropical North Atlantic built a drought and heat wave.
2024 opened already inside those events. Total carbon flux hit 0.81 ± 0.09 PgC, more than seven times group 1 and the highest annual mean in the 15-year series. Annual rain ran 462 mm below group 1 and annual temperature 1.2 C above it. Burned area was 182% higher than group 1, the largest in the MapBiomas series the authors use from 2010 onward. After Brasilia restored anti-clearing policy in 2023, fire became a common tool of clearing. PRODES attributed 38% of 2024 deforestation to fire.
That split is the live argument in Brazil as well. Official clearing kept falling, with the 2024 Legal Amazon rate consolidating at 6,518 km2 and the August 2024-July 2025 estimate at 5,796 km2, while INPE fire detections for 2026 had already passed 41,300 by late October, against 43,130 in all of 2025. The aircraft record says both facts can be true at once: the saw slowed, the match did not, and a dry year turned the match into a basin-scale source.
After Fire, the Standing Forest Roughly Breaks Even
The paper’s most awkward finding for a “dying forest” frame is net biome exchange. Strip out fire and the remaining flux, which mixes growth, death, soils, logging and other non-fire human work, sits near zero in all three groups. Group 3’s NBE is -0.06 ± 0.10 PgC a year. Group 1 still has a real sink, -0.20 ± 0.12, but even that only covers about two-thirds of the fires people light in those wetter years.
HOW THE FLUXES ARE SPLIT
- Total carbon flux: The column budget from each spiral profile, the number that says whether Amazonia added CO2 to the air that year.
- Fire carbon flux: The share inferred from measured CO/CO2 ratios in dry-season plumes, after natural carbon monoxide is removed.
- Net biome exchange: Total minus fire, the standing forest plus non-fire human work, near-neutral in every cluster.
Most years also show a positive near-surface CO2 excess versus the Atlantic background, so the basin as a whole is not offsetting its own anthropogenic emissions. Group 3 profiles pick up extra CO2 in the free troposphere as well, which the authors tie to convective lift from fires, not to a deep forest physiological failure.
Gatti has been circling this question since her 2021 and 2023 papers, which already had eastern Amazonia as a source tied to clearing and weaker law enforcement. The new record length is what lets the team put drought years and high-clearing years in separate bins and show they land in the same place.
Rain Fell 8% and Dry-Season Heat Rose 1.81 C
The human fingerprint is also in the climate the remaining trees now live in. Using the same rain and temperature data for 1979-2018 and then through 2024, the authors find that the last six years, when clearing accelerated from 2019 to 2022, moved the long-term lines. Annual rain from 1979 to 2018 had no significant trend (27 ± 69 mm). Extend the series to 2024 and the decline is 174 ± 69 mm, an 8% drop. Dry-season peak rain (August-October) fell 20% (83 ± 18 mm) over 1979-2024. Annual mean temperature rose 1.13 ± 0.13 C, and dry-season temperature 1.81 ± 0.18 C, with 0.20 C and 0.30 C of that coming in the last six years.
THE 46-YEAR CLIMATE SHIFT
- Annual rain: Down 174 ± 69 mm from 1979 to 2024, 8%, after a 1979-2018 change that was not significant.
- Dry-season rain: Down 83 ± 18 mm (20%) in August-October, the months when fires run.
- Annual heat: Up 1.13 ± 0.13 C, with dry-season heat up 1.81 ± 0.18 C.
- Last six years: Another 60,964 km2 of primary forest lost and 564,532 km2 burned between 2018 and 2024.
The southeast site, Alta Floresta, warmed 2.19 ± 0.21 C in the dry-season peak and 1.37 ± 0.15 C in the annual mean. That region lost 37,930 km2 of primary forest from 2018 to 2024, 62% of Brazilian Amazon primary loss in the period. The northeast site, Santarem, took the hardest rain cut: 304 ± 150 mm a year (12%) and 37% (77 ± 23 mm) in the dry-season peak, on 15,023 km2 of primary loss (25% of the Brazilian total). Moisture recycling by the forest still supplies up to half of Amazon rain, so each cleared hectare dries the next one.
Almost No Drought Fire Began With Lightning
Group 3’s fire carbon, 0.55 ± 0.10 PgC a year, is 72% above group 1. The obvious climate story is that drought made the forest ignite on its own. The authors tested that with cloud-to-ground strokes from the Earth Networks Total Lightning Network against INPE’s 375-metre active-fire detections, counting a lightning candidate only if it struck within 1 km and 72 hours before a fire. Quality lightning coverage is usable from 2017, so they ran 2023 and 2024 only.
Lightning-linked ignition was 1.6% of fires in 2023 and 1.0% in 2024. The schematic in the paper puts group 3 fires at 98% human-caused. Drought raised flammability. People still struck the matches, including as a clearing tool once the saw was under tighter watch.
That is the objection the El Nino-only reading never meets. A dry year without ignition would scorch leaves and lift tree death, which would show up in net biome exchange. Group 3’s NBE does not crash. The extra carbon is in the fire term.
Pasture, Soy and Mines Grew as the Sink Weakened
The Brazilian Amazon is 3.8 million km2, 58% of the pan-Amazon region in the study. Cumulative clearing there is now large enough that the remaining forest is working in a drier, hotter basin even when a given year is not an El Nino.
AMAZON LAND USE 2000 TO 2024
- 2000: Cumulative deforestation reaches 474,770 km2, 12.5% of the Brazilian Amazon.
- 2004: The total hits 612,225 km2 (15.5%), after which public policy cuts the annual rate 84% by 2012.
- 2012: Cumulative loss is 697,319 km2 (18.4%); the rate then rises again from 2013 and jumps after 2019.
- 2022: The total reaches 791,835 km2 (20.9%).
- 2024: Cumulative loss is 807,301 km2, 21.3% of original Brazilian Amazon forest, even after annual rates fell 30% in 2023 and 47% in 2024 versus 2019-2022.
From 2010 to 2024, pasture in the study area grew 19% to 561,416 km2, soy 193% to 59,368 km2, and mining 272% to 3,956 km2, per MapBiomas Collection 10. The forest still holds 123 ± 23 PgC in vegetation and soils. Each year’s net source of 0.32 PgC is a small slice of that stock and a large slice of the remaining sink’s ability to cover new fire.
A Zero-Fire Rule Is the Lever This Record Points To
Gatti, who coordinates INPE’s Greenhouse Gas Laboratory and now has four Nature lead papers on this flight programme, put the finding in blunt terms. Gatti described a development model built on destruction, and said the remaining forest is under severe stress as rain falls and heat rises in a loop that invites the next burn.
The main message of the research is shocking: the Amazon’s problem is human action. We are losing the forest because the region’s development model has been based on destruction. We need public policies that value the standing forest.
Luciana Vanni Gatti, coordinator of INPE’s Greenhouse Gas Laboratory, to Agencia FAPESP
The authors call for a zero-deforestation policy, tighter control of biomass burning, and restoration, on the grounds that climate stress and human fire now amplify each other. They warn that the southeast already became a growing carbon source after the very strong 2015-16 El Nino, and that 2023-24 may leave a similar scar across more of the basin.
A 2024 synthesis led by Bernardo Flores, with Carlos Nobre among the co-authors, estimated that by 2050 10% to 47% of Amazonian forests will face compounding disturbances that can push local stands into degraded or open states. Gatti’s fluxes do not prove a biome-wide tip has arrived. They do show that the carbon the world still counts on from this forest is already being spent on fires people set, and that a wet year can hide that bill only until the next dry one.
The open CO2 vertical-profile dataset for 2010-2024 is posted on PANGAEA. In 2024, PRODES found that 38% of Amazon deforestation was caused by fire.
Frequently Asked Questions
How were Amazon carbon fluxes measured from the aircraft profiles?
Each flight was a descending helix from 4.4 km above sea level to about 0.3 km, with flasks at 12 heights, usually twice a month between 12:00 and 13:00 local time, analysed for CO2 and CO at INPE’s Greenhouse Gas Laboratory in Sao Jose dos Campos. Flux is a column budget: the CO2 excess versus an Atlantic background, divided by the HYSPLIT travel time from the coast, which averages 2.6 days at Santarem and 7.6 days at Cruzeiro do Sul. Uncertainties come from 1,000-run Monte Carlo draws; some missing months were filled with the missForest algorithm.
How much carbon is stored in Amazon vegetation and soils?
The paper uses a stock of 123 ± 23 PgC in vegetation and soils for Amazonia, a pool that is still vast next to the 0.32 PgC annual net source but is no longer growing fast enough to cover fire. A related 2024 synthesis put the Amazon’s carbon at 150-200 PgC, equivalent to 15-20 years of global CO2 emissions, which is a wider geographic and accounting frame than Gatti’s flux mask.
How did the team decide that lightning almost never started the 2023 and 2024 fires?
They paired Earth Networks cloud-to-ground strokes with INPE’s VIIRS 375 m active fires and kept a lightning candidate only if it fell inside a 1 km buffer and 72 hours before detection. In Amazonia the network’s stroke detection efficiency is above 50% (flash efficiency above 80%) and mean location error is below 1 km, weaker than in denser Brazilian grids, which is why they limited the test to 2023 and 2024, when that dataset is reliable.
What land area counts as Amazonia in this carbon budget?
The authors restrict the mask to forest ecosystem subregions, Amazonia stricto sensu, the Guianas and Gurupi, totalling 6,700,798 km2. Four sites (Santarem, Alta Floresta, Rio Branco, and a northwest rotation from Tabatinga to Tefe to Cruzeiro do Sul) supply the profiles; back-trajectory density from those sites covers 95% of that mask. Brazilian Legal Amazon figures such as PRODES totals apply to a smaller, national slice, 3.8 million km2, 58% of pan-Amazonia, and should not be read as the whole basin.

John Mayer Bets Sob Rock Can Be a Record Label

H1N1 Rises Early After Last Winter’s H3N2 Wave

Human Fires Drive Amazon Carbon Emissions Even Without Drought

Charli XCX Secretly Films a Cameo in Scorsese’s Horror

Santos’s 58-Yard Kick Decides the Williams-Maye Rematch

Generation Lab’s Secret Youth Shot Has a Copycat Problem

Tesla Raises Dual Motor Prices as Texas Builds Cybercabs

The Nantucket Friendship Basket Boom Meets a Maker Shortage

Bristol Myers Quits Cellares as Autoimmune Doses Proceed

Okta Stock Jumps 20% on McKinnon’s Identity Bet
-
 NEWS2 months ago
Generation Lab’s Secret Youth Shot Has a Copycat Problem
-
 AUTO2 months ago
Tesla Raises Dual Motor Prices as Texas Builds Cybercabs
-
 LIFESTYLE2 months ago
The Nantucket Friendship Basket Boom Meets a Maker Shortage
-
 NEWS2 months ago
Okta Stock Jumps 20% on McKinnon’s Identity Bet
-
 BUSINESS2 months ago
Bristol Myers Quits Cellares as Autoimmune Doses Proceed
-

 BUSINESS2 months ago
Poland Closes Visa-Free Work for Three Fast-Growing Nationalities
-

 LIFESTYLE2 months ago
Labor Day Mattress Sales Repeat a Familiar Holiday Discount
-

 NEWS2 months ago
Ox Alpha Was a Chinese Chip Stress Test All Along